Thursday, October 23, 2008
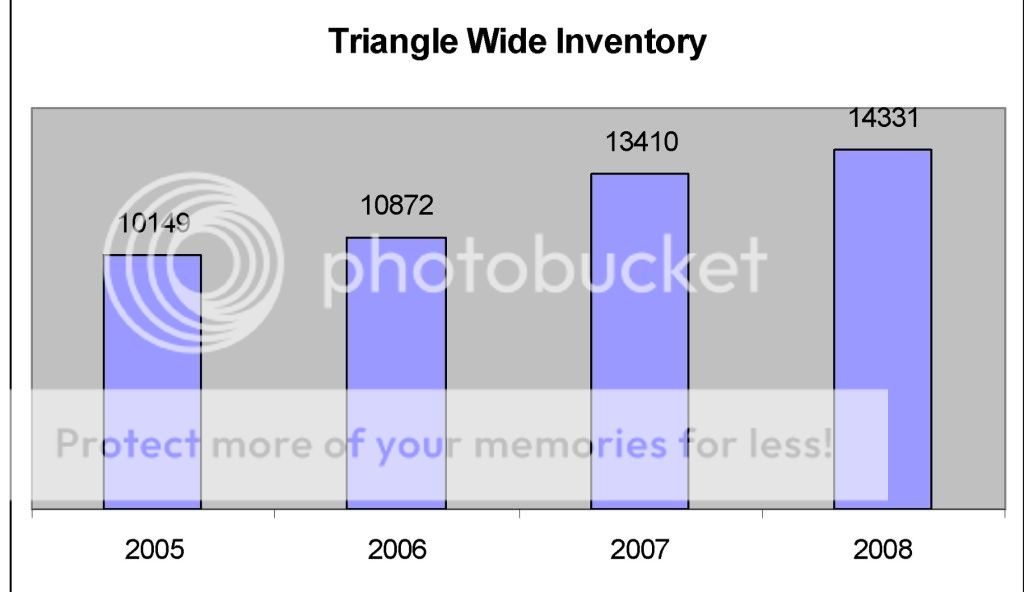
- Our overall inventory has grown by 7%. We have actually seen 29 months of consecutive inventory growth.
- We have also seen 20 consecutive months of lower pending sales.
- 63% of every price point has an over supply of inventory on the market.
- In September 2008, expired listings were 227% higher than the same time last year.
- Third quarter showings and pending sales are down 22% over the same time last year.


- Third quarter clsoings are down 27%. Although this is a significant decline, this is the 6th best quarter since 2002. It may be that the number of closings we are seeing now is closer to the normal average number of closings at this time of the year.

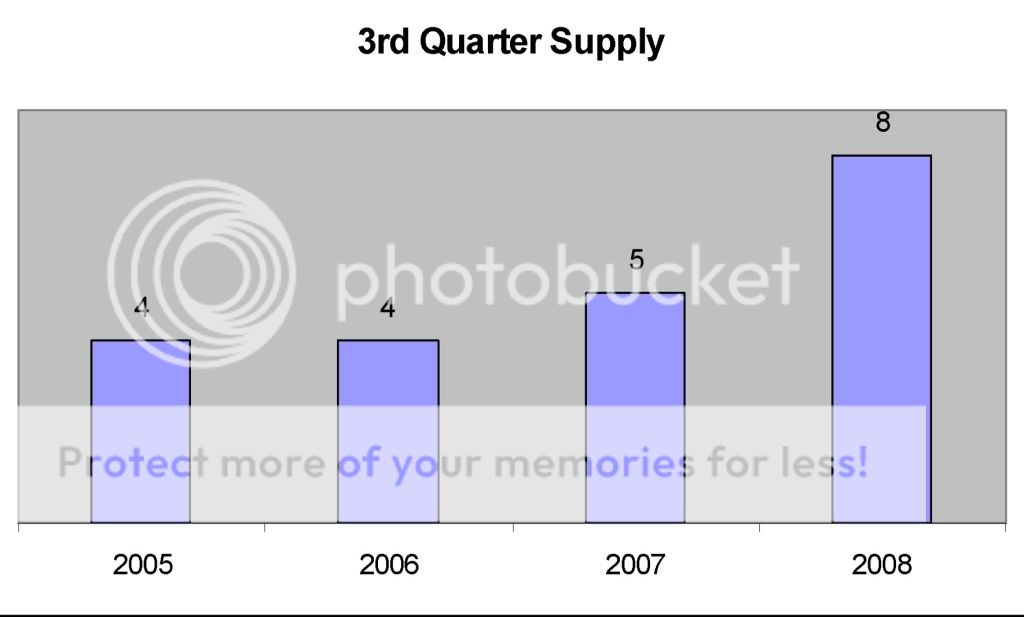
- The current supply of inventory is 8 months. This is up from 5 months at the same point last year. The Triangle Area is doing fairly well with regard to supply as compared with other areas such as South Florida (28%), Las Vegas (17%), Chicago (15%) and Nationally where the supply is at 11%.

- Average Days on Market are 88 which is up from 73 at the same time last year. On a very interesting note, for those houses where the list price equaled the sales price, the days on market are excellent at 55. This is compared with those houses where the original list price was greater than the sales price. In this case, the average days on market is closer to 108. This underscores the need to price your home right when you initially put it on the market; otherwise you could be looking at significant carrying costs.


- Average price appreciation for re-sale homes in the Raleigh, Durham, Chapel Hill area has been 4% and the average overall has been closer to 8%.

- Over the last year, North Carolina has seen an average appreciation of 3.59%, Wake County has seen 4.8% as compared with -4.8% appreciation nationally.
